Tutorial 7: Tutorial of PROST index.
In this tutorial, we provide a detailed introduction of PI on the human dorsolateral prefrontal cortex (DLPFC) 10x Visium ST dataset from (Pardo B. et al. 2022), which was manually annotated as the cortical layers and white matter (WM).
The original data and manual annotation are prepared and aviliable at google drive.
1.Load PROST and its dependent packages
import scanpy as sc
import os
import warnings
warnings.filterwarnings("ignore")
import sys
import PROST
PROST.__version__


>>> ' 1.1.2 '
2.Set up the working environment and import data
# the location of R (used for the mclust clustering)
ENVpath = "your path of PROST_ENV"            # refer to 'How to use PROST' section
os.environ['R_HOME'] = f'{ENVpath}/lib/R'
os.environ['R_USER'] = f'{ENVpath}/lib/python3.7/site-packages/rpy2'

# Set seed
SEED = 818
PROST.setup_seed(SEED)

#%% Read in data
section_num = 151672

# Set directory (If you want to use additional data, please     change the file path)
rootdir = 'datasets/DLPFC'

input_dir = os.path.join(f'{rootdir}', str(section_num))
spatial_dir = os.path.join(f'{rootdir}', str(section_num),  'spatial')
output_dir = os.path.join(f'{rootdir}', str(section_num),   'results')
if not os.path.isdir(output_dir):
    os.makedirs(output_dir)

# Read data from input_dir
adata = sc.read_visium(path=input_dir, count_file='{}_filtered_feature_bc_matrix.h5'.format(section_num))
adata.var_names_make_unique()


>>> Variable names are not unique. To make them unique, call `.var_names_make_unique`.
>>> Variable names are not unique. To make them unique, call `.var_names_make_unique`.
3.Calculate and save PI
# Calculate PI
adata = PROST.prepare_for_PI(adata, platform="visium")
adata = PROST.cal_PI(adata, platform="visium")

# Spatial autocorrelation test
PROST.spatial_autocorrelation(adata)

# Save PI result
adata.write_h5ad(output_dir+"/PI_result.h5")


>>> Filtering genes ...
>>> Calculating image index 1D:
>>> 100%|██████████| 4015/4015 [00:00<00:00, 70423.08it/s]
>>> Trying to set attribute `.var` of view, copying.
>>> Normalization to each gene:
>>> 100%|██████████| 5083/5083 [00:00<00:00, 13624.30it/s]
>>> Gaussian filtering for each gene:
>>> 100%|██████████| 5083/5083 [01:07<00:00, 74.99it/s]
>>> Binary segmentation for each gene:
>>> 100%|██████████| 5083/5083 [03:44<00:00, 22.60it/s]
>>> Spliting subregions for each gene:
>>> 100%|██████████| 5083/5083 [01:14<00:00, 68.52it/s]
>>> Computing PROST Index for each gene:
>>> 100%|██████████| 5083/5083 [00:03<00:00, 1478.57it/s]
>>> PROST Index calculation completed !!
4.Pre-process
# Read PI result
adata = sc.read(output_dir+"/PI_result.h5")

# Remove MT-gene
drop_gene_name = "MT-"
selected_gene_name = list(adata.var_names[adata.var_names.str.contains("MT-") == False])
adata = PROST.feature_selection(adata, selected_gene_name=selected_gene_name)
adata


>>> View of AnnData object with n_obs × n_vars = 4015 × 5070
>>> obs: 'in_tissue', 'array_row', 'array_col', 'image_idx_1d'
>>> var: 'gene_ids', 'feature_types', 'genome', 'n_cells', 'SEP', 'SIG', 'PI', 'Moran_I', 'Geary_C', 'p_norm', 'p_rand', 'fdr_norm', 'fdr_rand', 'selected'
>>> uns: 'binary_image', 'del_index', 'gau_fea', 'locates', 'nor_counts', 'spatial', 'subregions'
>>> obsm: 'spatial'
5.Sort PI in descending order
PI_result = adata.var[['SEP','SIG','PI','fdr_rand']]
PI_sort = PI_result.sort_values(by="PI", ascending=False)
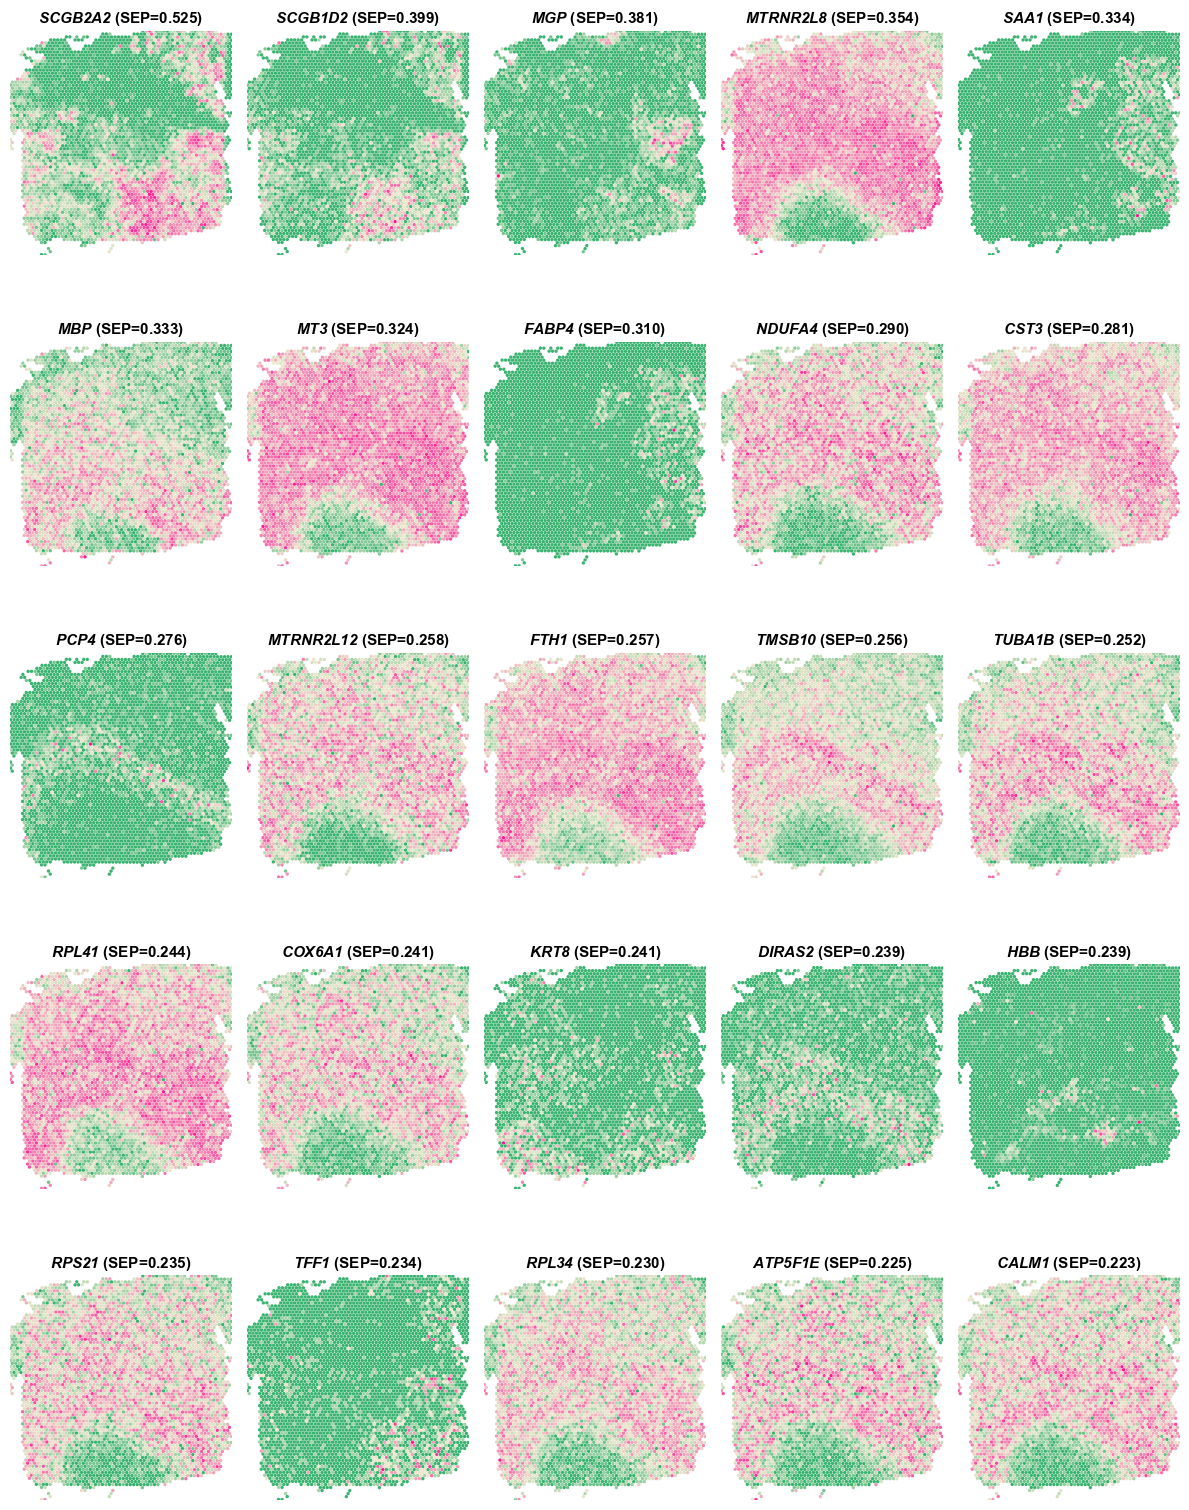
# Plot genes in descending order of Separability
PROST.plot_gene(adata, platform="visium", sorted_by="SEP", top_n=25, size=2)
>>> Drawing pictures:
>>> 100%|██████████████| 1/1 [00:00<00:00, 1.15it/s]
>>> Drawing completed !!
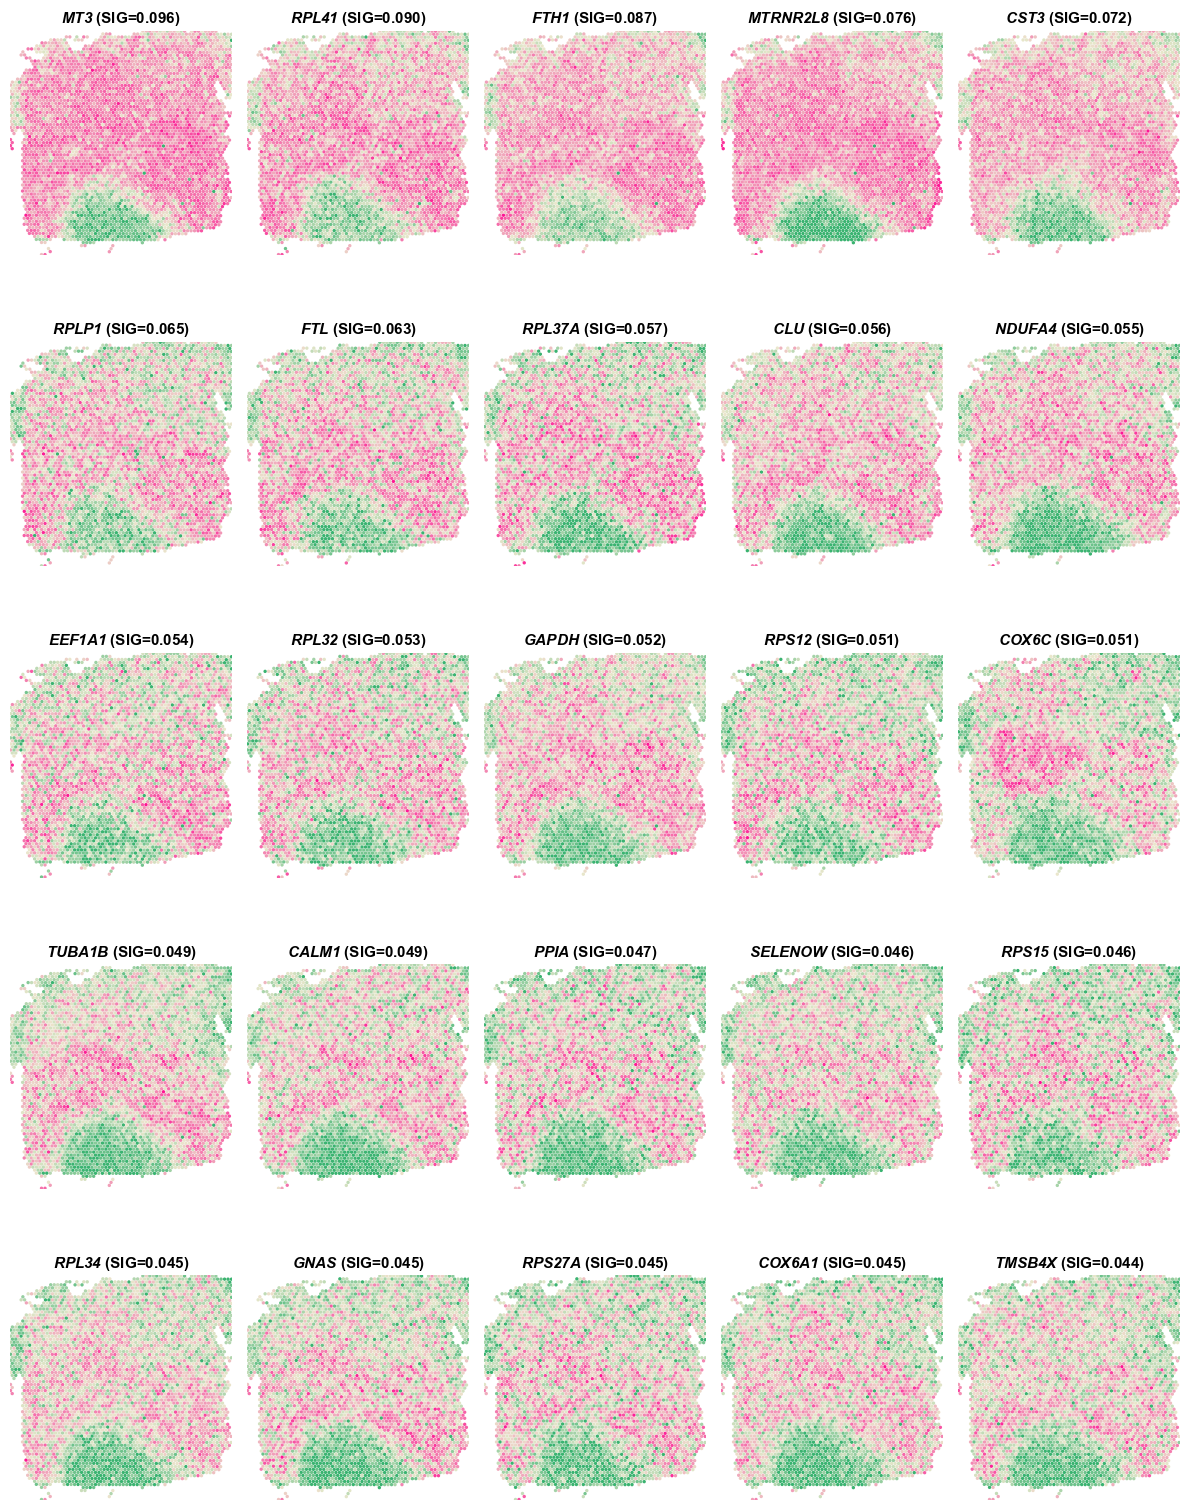
# Plot genes in descending order of Significance
PROST.plot_gene(adata, platform="visium", sorted_by="SIG", top_n=25, size=2)

>>> Drawing pictures:
>>> 100%|██████████████| 1/1 [00:00<00:00,  1.15it/s]
>>> Drawing completed !!
# Plot genes in descending order of PI
PROST.plot_gene(adata, platform="visium", sorted_by="PI", top_n=25, size=2)

>>> Drawing pictures:
>>> 100%|██████████████| 1/1 [00:00<00:00,  1.15it/s]
>>> Drawing completed !!
